PDF

Electron Beam Divergence Due to Self Potential
Introduction
When modeling the propagation of a charged particle beam at a high current, the electric field due to the space charge of the beam significantly affects the trajectories of the charged particles. Perturbations to these trajectories, in turn, affect the space charge distribution. In order to accurately predict the properties of the beam, the particle trajectories and fields must be computed in a self-consistent manner. The Charged Particle Tracing interface can use an iterative procedure to efficiently compute the strongly coupled particle trajectories and electric field for systems operating under steady-state conditions. Such a procedure reduces the required number of model particles by several orders of magnitude, compared to methods based on explicit modeling of Coulomb interactions between the beam particles. A mesh refinement study confirms that the solution agrees with the analytical expression for the shape of a nonrelativistic, paraxial beam envelope.
Note: This application requires the Particle Tracing Module.
Model Definition
This model computes the shape of an electron beam propagating through free space. When the magnitude of the beam current is large enough that Coulomb interactions are significant, the shape of the beam may be determined by solving a set of strongly coupled equations for the beam potential and the electron trajectories,
The beam electrons are assumed to be nonrelativistic so that magnetic forces can be neglected. Modeling the beam electrons and the resulting electric potential using a time-dependent study would require a very large number of model particles to be released at a large number of time intervals. Instead, this model computes the shape of the electron beam by coupling a time-dependent study step for computing the particle trajectories to a stationary step for computing the electric potential. This algorithm is suitable for modeling beams which operate at steady-state conditions. It consists of the following steps:
1
2
Compute the electric potential due to the space charge density of the beam, using a stationary solver. The model uses an Infinite Element Domain region to apply appropriate boundary conditions for a beam propagating in free space.
3
4
After several iterations, the particle trajectories and the corresponding space charge density and electric field reach a stable, self-consistent solution. For a nonrelativistic, paraxial beam of electrons, the shape of the beam envelope is given by Ref. 1 as
(1)
where z is the distance from the beam waist, R0 is the waist radius, K is the generalized beam perveance,
χ is the ratio of the beam radius to the beam waist radius, and
(2)
This analytical expression for the relationship between axial position and beam envelope radius is used to determine the accuracy of the solution. A mesh refinement study confirms that the agreement between the solutions improves as the mesh element size is reduced.
In this example, Specify current is selected from the Particle release specification list in the physics interface Particle Properties section. As a result, each model particle represents a continuous stream of particles, released at regular time intervals, rather than the instantaneous position of a charge. For the purpose of modeling particle-field interactions, each model particle leaves behind a trail of space charge in its wake. The contribution of each model particle to the total space charge density of the beam is found by evaluating the sum
where e is the elementary charge, Z is the charge number of the particles, δ is the Dirac delta function, and frel is the effective frequency of release of the particle. The frequency of release is the number of particles per model particle per second. To avoid the infinite potential associated with an infinitesimally small point charge, the space charge density is distributed uniformly over each mesh element before the electrostatics problem is solved.
Results and Discussion
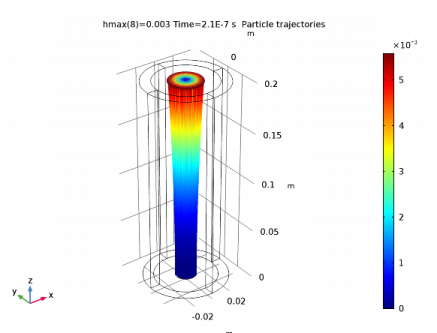
After several iterations, the model reaches a self-consistent solution for the trajectories of the electrons and the beam potential. The electron trajectories are plotted in Figure 1. The expression r-at(0,r) is used to define a color expression for the trajectories. The at operator is used to evaluate an expression at the initial time, rather than the current time. Thus the color expression gives the radial displacement of each particle due to space charge effects.
Figure 1: A beam of electrons with a waist located at z = 0 diverges due to transverse beam forces. The color represents the radial displacement of each electron from its initial position.
The electric potential distribution in the beam is shown in Figure 2. Since the beam propagates from left to right, and the beam electrons initially move in the positive z direction, the left end of the plot corresponds to the beam waist. This is also the location where the beam radius is smallest in magnitude.
Figure 2: Plot of the electric potential of the electron beam. The potential is greatest in magnitude close to the beam waist.
A mesh refinement study confirms that the shape of the beam envelope agrees more closely with the analytical expression of Equation 1 as the maximum mesh element size is reduced. The distance from the beam waist as a function of beam radius is compared to the result of this expression, and the relative error is plotted in Figure 3. For all values of the maximum element size, the error shown is computed after three iterations of the solver loop.
These results show that a self-consistent solution for the particle trajectories and the fields due to their space charge density can be obtained using an iterative solver sequence. This requires much less time and memory than a fully coupled time-dependent study of the individual beam particles and their fields. The accuracy of the solution clearly improves as the mesh element size is reduced, enabling more accurate computation of the electron trajectories and beam potential.
Figure 3: The results of a mesh refinement study indicate that the observed relationship between beam radius and distance from the beam waist converges to the expected value as the mesh is refined. The comparison is made at a location 0.2 meters from the waist.
Reference
1. S. Humphries, Charged Particle Beams, Dover Publications, New York, 2013.
Application Library path: ACDC_Module/Particle_Tracing/electron_beam_divergence
Modeling Instructions
From the File menu, choose New.
New
In the New window, click Model Wizard.
Model Wizard
1
In the Model Wizard window, click 3D.
2
In the Select Physics tree, select AC/DC>Particle Tracing>Particle Field Interaction, Non-Relativistic.
3
Click Add.
4
Click Study.
5
In the Select Study tree, select Preset Studies for Selected Physics Interfaces>Bidirectionally Coupled Particle Tracing.
6
Click Done.
Global Definitions
Parameters
1
On the Home toolbar, click Parameters.
To save time, the parameters can be loaded from a file.
2
In the Settings window for Parameters, locate the Parameters section.
3
Click Load from File.
4
Geometry 1
Cylinder 1 (cyl1)
1
On the Geometry toolbar, click Cylinder.
2
In the Settings window for Cylinder, locate the Size and Shape section.
3
In the Radius text field, type r2.
4
In the Height text field, type L.
5
Click to expand the Layers section. In the table, enter the following settings:
6
Right-click Cylinder 1 (cyl1) and choose Build Selected.
Work Plane 1 (wp1)
1
On the Geometry toolbar, click Work Plane.
2
In the Settings window for Work Plane, locate the Plane Definition section.
3
From the Plane type list, choose Face parallel.
4
Find the Planar face subsection. Select the Active toggle button.
5
On the object cyl1, select Boundary 10 only.
6
Click Show Work Plane.
Circle 1 (c1)
1
On the Work Plane toolbar, click Primitives and choose Circle.
2
In the Settings window for Circle, locate the Size and Shape section.
3
In the Radius text field, type r0beam.
4
Right-click Circle 1 (c1) and choose Build Selected.
Materials
Material 1 (mat1)
1
In the Model Builder window, under Component 1 (comp1) right-click Materials and choose Blank Material.
2
In the Settings window for Material, locate the Material Contents section.
3
Definitions
Variables 1
1
On the Home toolbar, click Variables and choose Local Variables.
2
In the Settings window for Variables, locate the Variables section.
3
To model a drifting electron beam propagating in a large, open area, surround the modeling domain with an Infinite Element Domain. This results in appropriate boundary conditions for the electric potential.
Infinite Element Domain 1 (ie1)
1
On the Definitions toolbar, click Infinite Element Domain.
2
In the Settings window for Infinite Element Domain, locate the Geometry section.
3
From the Type list, choose Cylindrical.
4
Charged Particle Tracing (cpt)
Inlet 1
1
In the Model Builder window, under Component 1 (comp1) right-click Charged Particle Tracing (cpt) and choose Inlet.
2
3
In the Settings window for Inlet, locate the Release Current Magnitude section.
4
In the I text field, type Ibeam.
5
Locate the Initial Position section. From the Initial position list, choose Density.
6
In the N text field, type 1000.
7
Locate the Initial Velocity section. Specify the v0 vector as
Electric Force 1
1
In the Model Builder window, under Component 1 (comp1)>Charged Particle Tracing (cpt) click Electric Force 1.
2
3
In the Settings window for Electric Force, locate the Electric Force section.
4
From the E list, choose Electric field (es/ccn1).
5
Locate the Advanced Settings section. Select the Use piecewise polynomial recovery on field check box.
Electrostatics (es)
On the Physics toolbar, click Charged Particle Tracing (cpt) and choose Electrostatics (es).
Ground 1
1
In the Model Builder window, under Component 1 (comp1) right-click Electrostatics (es) and choose Ground.
2
Mesh 1
Free Tetrahedral 1
1
In the Model Builder window, under Component 1 (comp1) right-click Mesh 1 and choose Free Tetrahedral.
2
In the Settings window for Free Tetrahedral, locate the Domain Selection section.
3
From the Geometric entity level list, choose Domain.
4
Size 1
1
Right-click Component 1 (comp1)>Mesh 1>Free Tetrahedral 1 and choose Size.
2
In the Settings window for Size, locate the Element Size section.
3
Click the Custom button.
4
Locate the Element Size Parameters section. Select the Maximum element size check box.
5
Distribution 1
1
In the Model Builder window, right-click Mesh 1 and choose Swept.
2
Right-click Swept 1 and choose Distribution.
3
In the Settings window for Distribution, click Build All.
Study 1
Step 1: Bidirectionally Coupled Particle Tracing
1
In the Settings window for Bidirectionally Coupled Particle Tracing, locate the Study Settings section.
2
Click Range.
3
In the Range dialog box, type 1e-8 in the Step text field.
4
In the Stop text field, type 21e-8.
5
Click Replace.
6
In the Settings window for Bidirectionally Coupled Particle Tracing, locate the Iterations section.
7
From the Termination method list, choose Convergence of global variable.
8
In the Global variable text field, type qrmax.
9
In the Relative tolerance text field, type 1E-5.
10
In the Relative tolerance threshold text field, type 0.015.
11
In the Maximum number of iterations text field, type 8.
Use a Parametric Sweep to confirm that a finer mesh results in closer agreement with the expected beam envelope size.
Parametric Sweep
1
On the Study toolbar, click Parametric Sweep.
2
In the Settings window for Parametric Sweep, locate the Study Settings section.
3
Click Add.
4
5
Click Range.
6
In the Range dialog box, type 0.01 in the Start text field.
7
In the Step text field, type -0.001.
8
In the Stop text field, type 0.003.
9
Click Replace.
The smallest mesh size requires about 5 GB RAM.
10
On the Study toolbar, click Compute.
Results
Plot the trajectories of the electrons, using a Color Expression to observe their radial displacement over time.
Particle Trajectories 1
1
In the Model Builder window, expand the Results>Particle Trajectories (cpt) node, then click Particle Trajectories 1.
2
In the Settings window for Particle Trajectories, locate the Coloring and Style section.
3
Find the Line style subsection. From the Type list, choose Line.
Color Expression 1
1
In the Model Builder window, expand the Particle Trajectories 1 node, then click Color Expression 1.
2
In the Settings window for Color Expression, locate the Expression section.
3
In the Expression text field, type qr-at(0,qr).
4
On the Particle Trajectories (cpt) toolbar, click Plot.
5
Click the Zoom Extents button on the Graphics toolbar. This plot should look like Figure 1.
Data Sets
The electric potential can be visualized more clearly by excluding the selection of the Infinite Element Domain from the Study 1/Parametric Solutions 1 (sol2) data set.
Study 1/Parametric Solutions 1 (sol2)
In the Model Builder window, expand the Results>Data Sets node, then click Study 1/Parametric Solutions 1 (sol2).
Selection
1
On the Results toolbar, click Selection.
2
In the Settings window for Selection, locate the Geometric Entity Selection section.
3
From the Geometric entity level list, choose Domain.
4
Electric Potential (es)
1
In the Model Builder window, under Results click Electric Potential (es).
2
In the Settings window for 3D Plot Group, click to expand the Color legend section.
3
Locate the Color Legend section. From the Position list, choose Bottom.
4
Click the Go to ZX View button on the Graphics toolbar. This plot should look like Figure 2.
For each mesh size, compare the beam envelope shape to the analytical solution for a paraxial, nonrelativistic beam.
1D Plot Group 3
1
On the Results toolbar, click 1D Plot Group.
2
In the Settings window for 1D Plot Group, locate the Data section.
3
From the Data set list, choose Study 1/Parametric Solutions 1 (sol2).
4
From the Time selection list, choose Last.
Global 1
1
Right-click 1D Plot Group 3 and choose Global.
2
In the Settings window for Global, type Relative Error in Longitudinal Beam Displacement in the Label text field.
3
Locate the y-Axis Data section. In the table, enter the following settings:
This expression is Equation 1, where the first argument of the integrate operator is the integrand of Equation 2. The lower limit of integration is increased by the floating point relative accuracy eps (machine epsilon, 252 or about 2.2204×10¹⁶) to avoid division by zero during numerical integration.
4
Locate the x-Axis Data section. From the Axis source data list, choose hmax.
5
On the 1D Plot Group 3 toolbar, click Plot. This plot should look like Figure 3.