Heat Transfer Coefficients — External Natural Convection
Vertical Wall
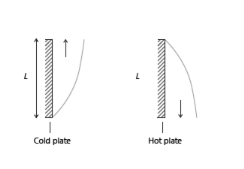
Figure 4-17: Schematic representation of geometry and parameters for the heat transfer coefficient correlation applied to natural convection on a vertical wall.
The following correlations correspond to equations 9.26 and 9.27 in Ref. 18:
(4-125)
where the height of the wall, L, is a correlation input and
(4-126)
where in turn g is the acceleration of gravity equal to 9.81 m/s2. All material properties are evaluated at (T + Text) ⁄ 2. This correlation is valid for 104RaL 1013.
Inclined Wall
Figure 4-18: Schematic representation of geometry and parameters for the heat transfer coefficient correlation applied to natural convection on an inclined wall.
The following correlations correspond to equations 9.26 and 9.27 in Ref. 18 (the same as for a vertical wall):
(4-127)
where the length of the wall, L, is a correlation input and ϕ is the tilt angle (the angle between the wall and the vertical direction; ϕ = 0 for vertical walls). These correlations are valid for 60° < ϕ < 60° and 104RaL 1013.
The definition of the Raleigh number, RaL, is analogous to the one for vertical walls and is given by the following:
(4-128)
where in turn g denotes the gravitational acceleration, equal to 9.81 m/s2.
For turbulent flow, 1 is used instead of cos φ in the expression for h, because this gives better accuracy (see Ref. 38).
According to Ref. 18, correlations for inclined walls are only satisfactory for the top side of a cold plate or the down face of a hot plate. Hence, these correlations are not recommended for the bottom side of a cold face and for the top side of a hot plate.
The laminar-turbulent transition depends on φ (see Ref. 38). Unfortunately, little data is available about transition. There is some data available in Ref. 38 but this data is only approximative, according to the authors. In addition, data is only provided for water (Pr around 6). For this reason, the flow is defined as turbulent, independently of the φ value, when
All material properties are evaluated at (T + Text) ⁄ 2.
Horizontal Plate, Upside
Figure 4-19: Schematic representation of geometry and parameters for the heat transfer coefficient correlation applied to natural convection on the top surface of an horizontal plate.
The following correlations correspond to equations 9.30–9.32 in Ref. 18 but can also be found as equations 7.77 and 7.78 in Ref. 38.
If T > Text, then
(4-129)
while if  Text, then
(4-130)
RaL is given by Equation 4-126, and L, the characteristic length (defined as area/perimeter, see Ref. 38) is a correlation input. The material data are evaluated at (T + Text) ⁄ 2.
Horizontal Plate, Downside
Figure 4-20: Schematic representation of geometry and parameters for the heat transfer coefficient correlation applied to natural convection on the bottom surface of an horizontal plate.
Equation 4-129 is used when  Text and Equation 4-130 is used when T > Text. Otherwise it is the same implementation as for Horizontal Plate, Upside.
Long horizontal cylinder
Figure 4-21: Schematic representation of geometry and parameters for the heat transfer coefficient correlation applied to natural convection on a long horizontal cylinder.
The following correlations correspond to equations 9.34 in Ref. 18. It is validated for RaD ≤ 1012.
(4-131)
Here D is the cylinder diameter and RaD is given by
The material data are evaluated at (T + Text) ⁄ 2.
Sphere
Figure 4-22: Schematic representation of geometry and parameters for the heat transfer coefficient correlation applied to natural convection on a sphere.
The following correlations correspond to equation 9.35 in Ref. 18. It is validated for RaD ≤ 1011 and Pr ≥ 0.7.
(4-132)
Here D is the cylinder diameter and RaD is given by
The material data are evaluated at (T + Text) ⁄ 2.
Vertical Thin Cylinder
Figure 4-23: Schematic representation of geometry and parameters for the heat transfer coefficient correlation applied to natural convection on a vertical thin cylinder.
The following correlation corresponds to equation 7.83 in Ref. 38. It is validated only for side walls of the thin cylinder (δT ≥ D), the horizontal disks (top and bottom) should be treated as horizontal plates. If the boundary thin layer is much smaller than D, vertical wall correlations should be used.
where D is the cylinder diameter, H is the cylinder height, and RaH is given by
The material data are evaluated at (T + Text) ⁄ 2.